How to display record counts on a stacked bar chart in CRM

TL;DR export the chart, find the line of xml which reads as follows, and add IsValueShownAsLabel="True"

If you'd like a step-by-step, read on!

Why use a stacked bar chart?

Stacked bar charts are useful for grouping data that are easily categorised. Take for example the statuses of Leads and Opportunities: Qualified, Disqualified, Open, Won and Lost. Each entity only has a few statuses, which makes for a clean chart.

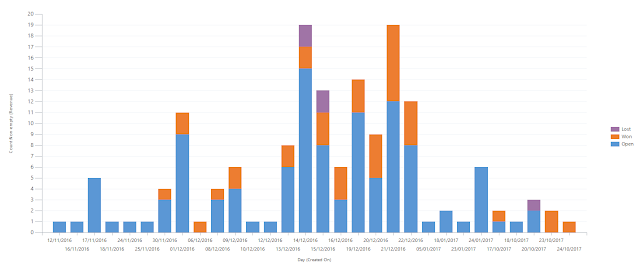
The following example displays opportunities created per day, grouped by their status:

The view itself is visually very informative, with each opportunity category displayed as a different colour. Clicking each individual bar drills down to display records of the chosen status in a separate view.

One enhancement, however, which is not customisable through the chart editor, could be the addition of a record count for each bars groups. In that way we'd be able to see how many open, won and lost opportunities we have per day at a glance without having to select each column.

To achieve this, we'll need to export the chart, edit its underlying xml code, and reimport the chart.

Step-by-step:

  • Step 1: Export the chart
  • Step 2: Edit the xml
  • Open the xml file with a text editor such as Notepad, Notepad++ or Visual Studio Code. Locate the line which begins Series ChartType= .. then add IsValueShownAsLabel="True"

  • Step 3: Import the chart

That's it! Observe that the complete version displays a number on each bars groups, showing how many records are won, lost and open:

How to Pass your Microsoft Exams

Watching videos on PartnerSource and reading notes are great ways to learn the material you need to pass your exams. But it can be boring. For certain exams there are days of videos to watch, rather than hours (see MB2-718).

I recently passed 3 exams on Microsoft Dynamics 365. I learnt a lot about the software, and I learnt a lot about how to revise. Here's how I did it.

Step by step

Step 1 read through the skills measured section of the exam page. This bullet points exactly what you need to know.

Step 2 find your sources. These should be videos from PartnerSource and blog posts. Neil Parkhurst's blog is a fantastic example of someone who's documented their learning for your benefit.

Step 3 take notes. This stops your mind from wandering and keeps you engaged with the material you're watching and reading.

Step 4 create your own practice exam.

If you turn your notes into multiple choice questions, they can be fed into an exam simulator. This has the benefits of:
  • being in the same format as the exam itself
  • allowing you to learn visually
  • being interactive and responsive

I've written a very basic exam console which you can download from GitHub. Here it is in action:

It works by feeding in a .json file, which you can simply create from your notes. The file should be formatted as follows:

As an alternative, you may consider Florian Krönert's certification trainer: a well-documented, graphically stunning certification trainer. It too reads in a .json file and provides you with a multiple choice interface and feedback on your answers.

Best of luck with your exams